Executive dashboards
High-level business summaries for founders, directors and managers who need quick visibility into revenue, leads, operations and delivery status.
Reporting Dashboard Development
Nuvyqo builds KPI dashboards, SQL reports, operational summaries and management views that help teams track revenue, leads, payments, access, performance and daily business activity with clarity.
What dashboards solve
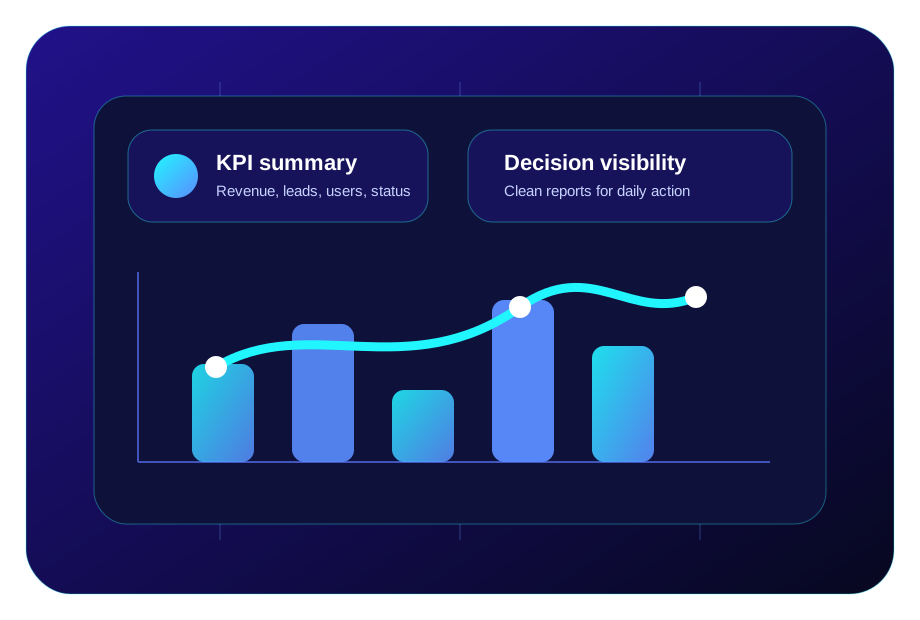
Most growing businesses have useful data, but it is spread across Excel files, forms, payment systems, admin panels, databases and manual reports. Nuvyqo converts that data into clean dashboards that support action.
High-level business summaries for founders, directors and managers who need quick visibility into revenue, leads, operations and delivery status.
Daily workflow reports for teams handling registrations, customers, service delivery, payments, support, exams, content, inventory or internal processes.
SQL Server reporting queries, stored procedure driven summaries, clean data views, exports and repeatable dashboard logic.
Delivery approach
A useful dashboard is not only a chart. It must answer the right business questions, use clean data, show clear status and help people decide what to do next.
Engagement models
Individual / Startup
Best for founders or small teams that need a simple KPI dashboard, lead report, payment summary or Excel-to-dashboard setup.
Company / Growth
Best for growing businesses that need multiple reports, filters, admin visibility, exports and repeatable reporting logic.
Enterprise / Complex
Best for complex systems with role-based reporting, multiple data sources, performance needs and phased reporting rollout.
Start with one dashboard
Share your current Excel, database report or manual summary. Nuvyqo will suggest a practical dashboard path that starts with useful visibility and scales into better operations.
A dashboard can show leads, enquiries, payments, sales status, operations, database activity, team work and business growth indicators.
Yes. Nuvyqo can build dashboard views from SQL Server data, reports and business workflows.
Yes. Even a small dashboard can help founders understand enquiries, conversions, work progress and growth signals.
Nuvyqo can work as your technology growth partner — helping you plan, build, launch and improve websites, cloud systems, databases, SEO, CRM workflows, automation and dashboards with transparent, stage-wise execution.